The Taxonomy of Bear Markets
Taxonomy is the science of filing things. Our commonly accepted zoological taxonomy, for instance, sets up a hierarchy of files under “family”, “genus”, “species”, and so on, and then fits every animal into one file or another. Some critters are easy to file, but others are not. The duck-billed platypus must have left taxonomists scratching their heads for awhile.
Making sense of the world by arranging, cataloguing, classifying things or events is not always easy because distinctions are often not clear-cut. Much of the world simply resists being neatly cubby-holed. For that reason, taxonomy is a fuzzy science, and some imagination is required to see similarities between one case and the next.
The Taxonomy Of Bears
Despite the hazards and limitations of taxonomy, I will attempt to identify and tag elements shared by bearish periods, as exhibited by the Dow Jones Industrial Average.
The next figure shows the general features of past bear markets.
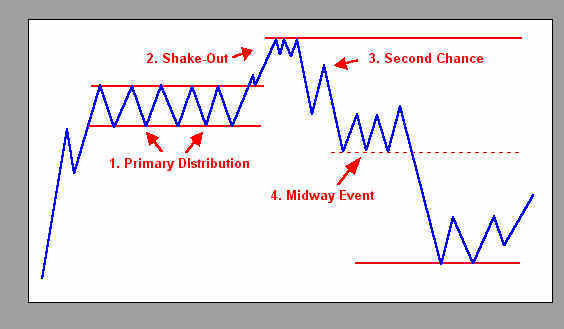
Four features are identified:
- Primary Distribution – Strong hands distribute shares to short-term traders and late-adopters who have been attracted to equities by a long period of rising prices.
- Shake Out – A breakout to new highs wrings out early shorts and draws in reluctant bulls. This call-up of short-term demand weakens the market technically as buying reserves become exhausted.
- Second Chance Rally – After an initial decline from the high provides a first sign of weakness, the market rallies. The generally bullish sentiment of investors is still intact and lower prices are seen as bargains. This rally offers a second chance to liquidate positions and presents the first good opportunity to establish short positions. Second-chance rallies may be considerable or relatively minor.
- Midway Event – The approximate midway point between the bull market high and the bear market low is marked by some technical event. The nature of this event varies. Most often, the market finds support, and either a rally or a period of consolidation follows. In a minority cases, the Midway Event is a truncated affair, amounting to no more than a few day’s consolidation or a gap in price as the market drops lower.
One more feature appears consistently in past bear markets. The period between the onset of primary distribution and the market’s bull market high (Period of Distribution) averages eight to nine months (see the next figure).

The approximate length of the Period of Distribution for each of the last six bear markets is given in the next table:
Period of Distribution
| 1929 | 9 months |
| 1937 | 6 months |
| 1968 | 9 months |
| 1972 | 9 months |
| 1987 | 8 months |
| 1990 | 11 months |
The past’s prologue.
The Tempest
Topping action which leads to a major decline is remarkably similar in the cases studied. As we shall see, however, there are big differences in the nature, extent and duration of the bear market declines which follow. Below is a chart of the DJ-30 from the end of 1928 through October 1929 (unless otherwise indicated, all charts are of the Dow Industrials). I cite this example only because the ’29 top is typical of those we will inspect. However, any comparison between the top in 1929 and the topping action of today’s market is not meant to suggest that the decline presently underway will be comparable to that of the thirties.
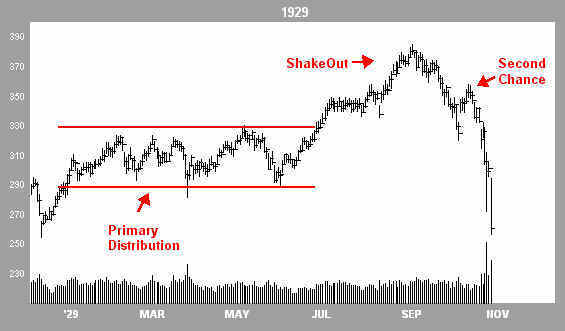
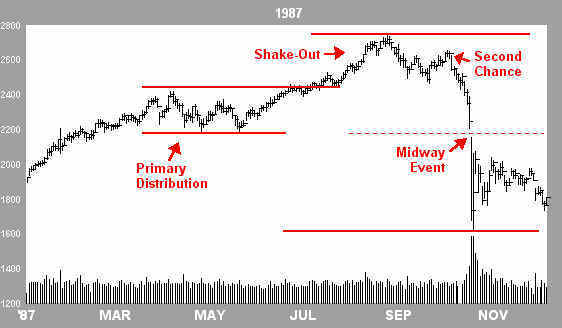
The first three elements of a top, Primary Distribution, Shake Out and Second Chance Rally, are present in the 1929 top (above). The 1987 top (below) exhibits the same general features. The 1987 chart shows the bear market from top to bottom. Note that the Midway Event is, in this case, simply a gap, left as the price plunges to a climax.
The 1990 top (next chart), while similar in important respects to both 1929 and 1987, produces a modest decline compared to ’29 or ’87. The Midway Event in 1990 is a relatively minor feature, as it was in 1987, amounting to no more than a brief pause.
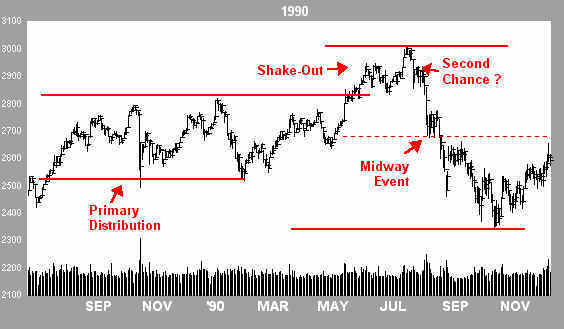
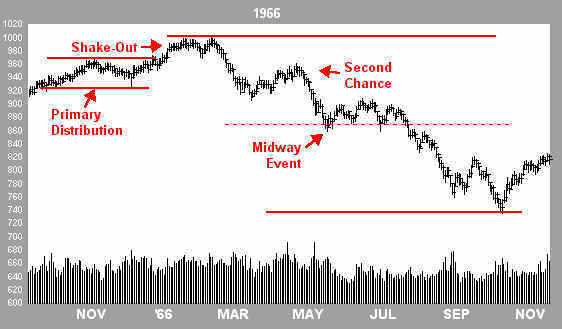
The Second Chance Rally in 1990 (above chart) was barely a rally at all. In contrast, the Second Chance offered in 1966 (below) was pronounced.
The Midway Event in 1966, an extended period of consolidation with support at the approximate midway point of the decline, is more typical of others in the record.
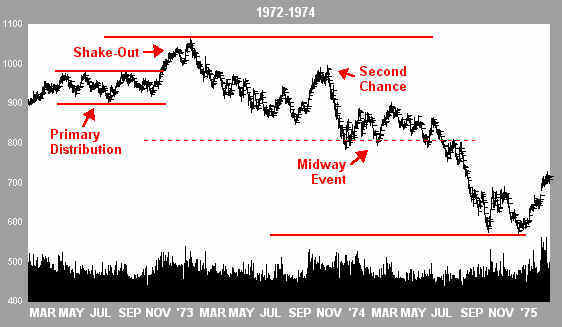
While the topping action in 1972 (below) was typical of other tops, the Second Chance rally was even more pronounced than the one in 1966 (above). One could argue that what I have identified as the Second Chance Rally was instead part of the Midway Event. However, that interpretation would distort what appears to be a more typical Midway Event, similar in nearly every respect to that of 1966 (above).
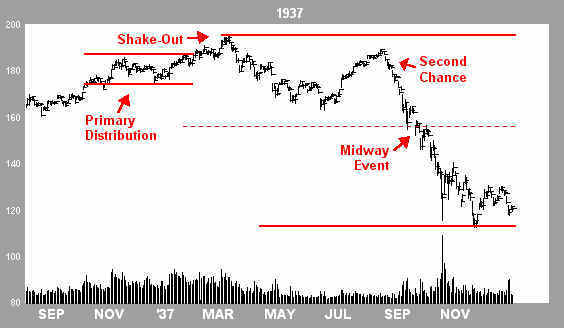
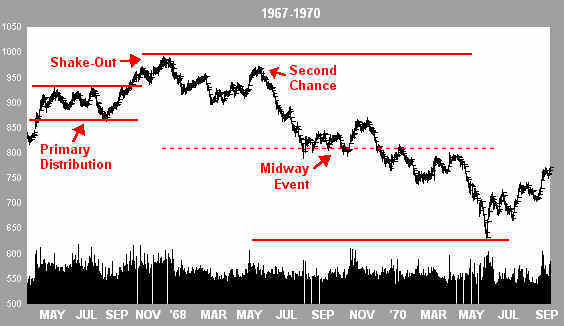
The next two charts, 1937 and 1967-1970, are shown below. Note that while the overall look of Primary Distribution and the Shake Out (Period of Distribution) is similar, features during subsequent declines, including the Second Chance Rally and the Midway Event, vary considerably.
Finally, let’s complete this retrospective with a chart showing the bear market of the thirties:
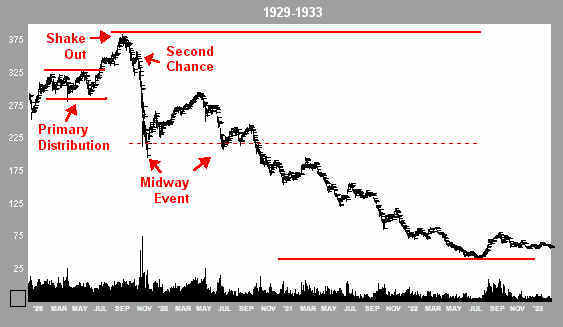
A few cautionary conclusions are in order. First, Primary Distribution and Shake Out may be similar from bear market to bear market, but the similarities end there. Analysis of the Period of Distribution may prompt reasonable speculation that a bear market is likely, but firm conclusions about the nature, duration or extent of a bear market decline from the analysis of topping action appear unwarranted. In particular, we cannot know that a Midway Event has occurred until after the fact. Taxonomy is, after all, descriptive, not predictive.


Join the discussion